Market narrowness, tranquillity, low correlation between single stocks and higher dispersion. Is this a bear market rally or do the signs point to a continuation of the bull market?
Market narrowness, tranquillity, low correlation between single stocks and higher dispersion. Is this a bear market rally or do the signs point to a continuation of the bull market?
20 June 2023
Market Narrowness: What Does History Teach Us?
The AI hype, gains in megacap stocks and/or hopes that the Federal Reserve might be nearing the end of its monetary tightening cycle have lifted equity indexes in recent weeks: the S&P 500 Index is now more than 20% above its October 2022 low.1
But delve a little deeper, and most of the gains have been driven by three sectors – information technology, communications and consumer discretionary – and within those, a few stocks (Figure 1). Indeed, just seven stocks have been responsible for the S&P 500’s 12% gain this year: Nvidia, Tesla, Google (Alphabet), Microsoft, Apple, Amazon and Facebook parent Meta.2
Figure 1. Relative Outperformance by Mega Cap Names…
Problems loading this infographic? - Please click here
Source: Bloomberg; as of 2 June 2023.
Note: The organisations mentioned are for reference purposes only. The content of this material should not be construed as a recommendation for their purchase or sale.
Figure 2. …Has Increased Concentration in Indices
Problems loading this infographic? - Please click here
Source: Bloomberg; as of 2 June 2023.
Note: Combined sectors show subtotal of weights and weighted average YTD%.
On the other hand, the equal-weighted version of the S&P 500 (‘SPW’) is up less than 3% this year.3 Indeed, the 3-month annualised spread between the cap-weighted S&P 500 and the equal-weighted one has hit more than 40%, only the third time it has done so since October 1990 (Figure 2). The previous two times the spread was higher than 40% was in January 2000 and December 1999.
Figure 3. Three-Month Annualised Spread Between SPX and SPW
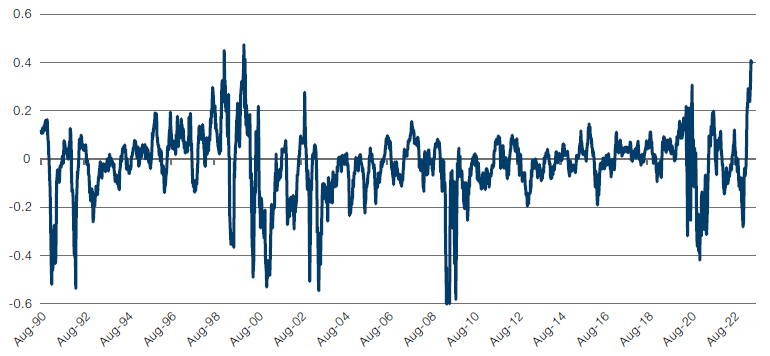
Source: Man Group; as of 9 June 2023.
So what can history tell us about previous episodes of market narrowness? Our analysis offers three takeaways:
1. Typically, the S&P 500 has continued to go up after hitting an annualised outperformance of X versus W of 30%;
2. Over the following three months, the equal-weighted S&P 500 has tended to catch up;
3. The narrowness had continued over the following six months.
Tranquillity + Dispersion = Bullish Markets?
Two other developments in the equity markets have caught our eye this past week.
First, the CBOE Volatility Index has dropped below 14, its lowest level in more than three years (Figure 3). In comparison, the 10-year average is 18. The VIX has fallen from its high in October despite rising interest rates, a cost-of-living crisis and regional bank failures in the US. Market participants believe this depicts the calm before the storm, which brings us to our second development: correlation between single stocks.
During times of market stress – such as during the depths of the COVID-19 selloff in March 2020 – correlation between single stocks tends to be closer to 1. Intuitively, this makes sense: if investors are panicking, markets tend to sell off, impacting all stocks. Currently, 1-month pairwise correlation of stocks within the S&P 500 Index is less than 20%4, signalling market dispersion, which should make an attractive hunting ground for stock pickers.
Figure 4. VIX Saw a 13 Handle for First Time Since February 2020
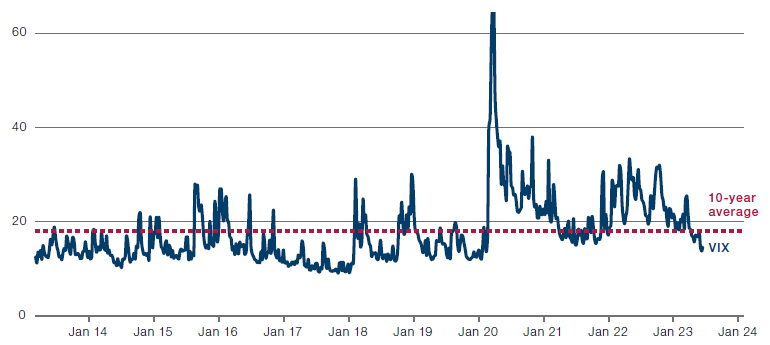
Source: Bloomberg; as of 14 June 2023.
1. Source: Bloomberg.
2. Source: Financial Times; 9 June 2023.
3. Source: Financial Times; 9 June 2023.
4. Source: Morgan Stanley.
With contribution from: Jonathan Daffron (Man FRM, Deputy Head of Investment Risk) and Ed Cole (Man GLG, Managing Director – Discretionary Investments).
You are now exiting our website
Please be aware that you are now exiting the Man Institute | Man Group website. Links to our social media pages are provided only as a reference and courtesy to our users. Man Institute | Man Group has no control over such pages, does not recommend or endorse any opinions or non-Man Institute | Man Group related information or content of such sites and makes no warranties as to their content. Man Institute | Man Group assumes no liability for non Man Institute | Man Group related information contained in social media pages. Please note that the social media sites may have different terms of use, privacy and/or security policy from Man Institute | Man Group.