Trend-following strategies perform as well as equities in the long term, yet get there with lower risk, smaller drawdowns, and do best when equities are at their worst. What’s not to like about that?
Trend-following strategies perform as well as equities in the long term, yet get there with lower risk, smaller drawdowns, and do best when equities are at their worst. What’s not to like about that?
May 2023
Introduction
Trend-following strategies perform as well as equities in the long term, yet get there with lower risk, smaller drawdowns, and do best when equities are at their worst.
What’s not to like about that?
Trend-following should be at least as popular as equity investing, right? Well, given equity markets are nearly 300 times the size of trend-following’s assets under management1, either these facts are not well known, or there is some other issue.
In this short article, we touch on both possibilities.
Trend-Following Performs as Well as Equities in the Long Term. Really?
Since inception in 1986, the Barclay BTOP50 Index (which comprises of mostly trend-following strategies) has returned 7.0% annualised, only 0.7% shy of world stocks (Figure 1). Trend-following’s risk is significantly lower, however, whether risk is measured in terms of volatility (9.6% versus 14.4%) or maximum drawdown (-16% versus -50%).
Figure 1. Trend-Following Performance Versus World Stocks Since inception of BTOP50 Index
Problems loading this infographic? - Please click here
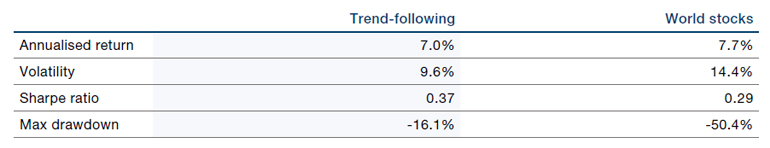
Source: Man Group, BarclayHedge, Bloomberg; between 1 January 1987 to 31 March 2023.
Trend-following represented by Barclay BTOP50 Index; world stocks represented by MSCI World Net Total Return Index hedged to USD.
At face value, trend-following is a remarkably simple strategy. Buy something that is going up; and sell something that is going down.
At face value, trend-following is a remarkably simple strategy. Buy something that is going up; and sell something that is going down. Finance 101 says that trends should not exist; markets are efficient, and information is instantaneously reflected in prices. Of course, this ignores the fact that decisions lag news flow, that economic cycles play out over years, and that humans get emotional; we hate losses more than we love gains, and in doing so we make irrational choices (see, for example, Kahneman & Tversky (1979)).
Try and earn a crust off trend-following in one market, however, and you might end up hungry. There’s only a slight edge, which is why managers run the strategy over tens, if not hundreds, of liquid markets to eke out consistent returns. They use computers for repeatability and because computers don’t get emotional.
Genuinely Diversifying
Since its inception, the correlation of the BTOP50 to world stocks and other traditional markets is effectively zero (Figure 2). Intuitively, this is because trend-followers seek to capture trends in all these markets simultaneously, either up or down. Our correlations also show just how little diversification is obtainable within asset classes. World stocks correlate to US stocks at 0.97, world bonds to US bonds at 0.86. The real surprise is that world stocks correlate to a diversified ‘60/40’ portfolio at 0.99.
Figure 2. Trend-Following Strategies Are Highly Diversifying
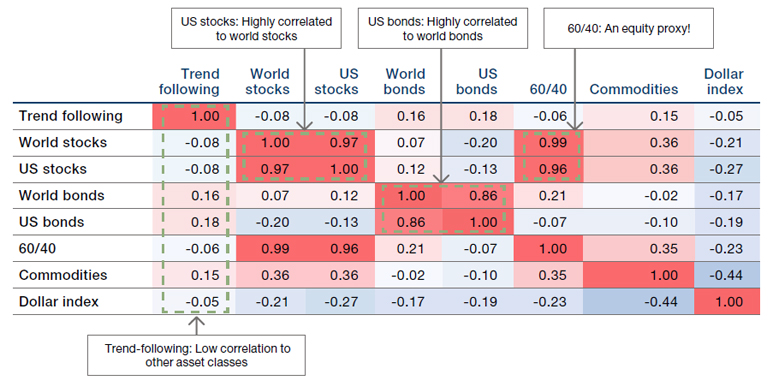
Source: Man Group, BarclayHedge, Bloomberg; From 1 January 1987 where available, otherwise from 31 January 1995 until 31 March 2023.
Trend-following represented by Barclay BTOP50, World stocks represented by MSCI World Net Total Return Index, US stocks represented by S&P 500 Index (Local Currency Gross Dividend Total Return, World bonds represented by Barclays Capital Global Aggregate Bond Index Hedged USD, US bonds represented by Bloomberg/EFFAS Bond Indices US Govt 5-10 Yr TR monthly return, 60/40 represented by 60% World stocks + 40% World bonds, Commodities represented by Dow Jones-UBS Commodity Total Return Index, Dollar index represented by US Dollar Index Spot
Trend-following strategies have another trick up their sleeve: negative correlation to risk assets in times of crisis.
Performs Best When Equities Are at Their Worst?
Long-term low correlation is one thing, but trend-following strategies have another trick up their sleeve; negative correlation to risk assets in times of crisis. Coined ‘Crisis Alpha’ (see, for example, Greyserman & Kaminski (2014)), it relates to trend-following’s historic positive performance during sustained equity market weakness. As Figure 3 illustrates, the BTOP50 returned 37% when the tech bubble bust and 17% during the Global Financial Crisis. Both of these episodes lasted years. During shorter periods such as the Covid-19 episode, however, performance is more mixed. This is because trend-following strategies take time – typically 3-6 months – to discover, and trade into, a new trend.
Figure 3. Trend-Following’s ‘Crisis Alpha’ Credentials
Problems loading this infographic? - Please click here
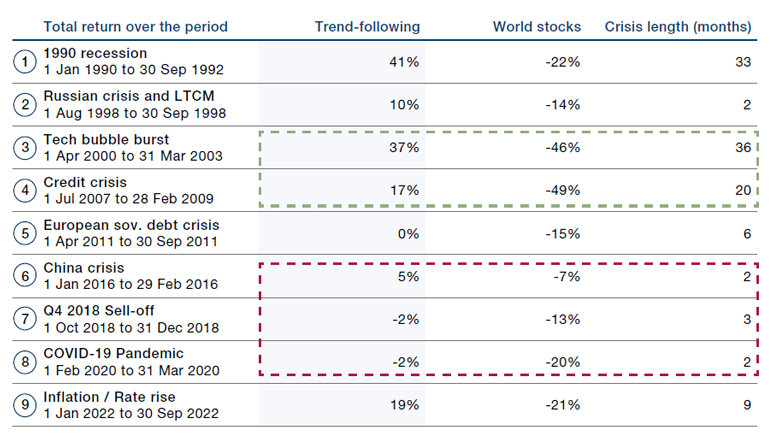
Source: Man Group, BarclayHedge, Bloomberg; Between 1 January 1987 and 31 March 2023.
Trend-following represented by Barclay BTOP50 Index; world stocks represented by MSCI World Net Total Return Index hedged to USD.
The periods selected are exceptional and the results do not reflect typical performance. The start and end dates of such events are subjective and different sources may suggest different date ranges, leading to different performance figures.
So Why Aren’t Trend-Following Strategies More Popular?
The performance of a traditional equity portfolio is fairly simple to understand, particularly if it is well-diversified. It hopefully goes up in the long term, but if there is a negative headline, a global pandemic for example, you might anticipate some losses. As we show in Figure 2, diversification across regions, or even a 40% allocation to bonds doesn’t help too much here.
Performance of a trend-following strategy is far less intuitive. Trend-following strategies trade many markets across multiple asset classes, not just equities. Indeed, a positive beta to equities, or risk assets in general, could originate from places other than equities; long emerging markets FX or short gold, for example. Complicating things further, this positioning can change as trends in different places emerge or dissipate. A trend-follower’s beta to any asset is dynamic.
How can an investor get comfortable with the performance of a trend-following strategy? The key lies in knowledge of positioning.
So how can an investor get comfortable with the performance of a trend-following strategy? The key lies in knowledge of positioning. That this is published in fact sheets is a given, but potential investors should understand what trend sensitivity is in their investment. ‘Medium-term’ trend-following space spans managers with trend sensitivity between two and six months, in our view. At the shorter end of that spectrum, a manager may be able to shift position quickly, being more responsive in a crisis.
At six months trend sensitivity, on the other hand, the manager may respond slower to a change in market direction, but should have improved longer-term performance (see 'The Need for Speed in Trend Following’ for more detail). Market choice can also be a factor in understanding performance (see, for example, ‘Gaining Momentum').
Trend-following strategies are often portrayed as ‘black box’, inferring opaqueness or mystery, which could originate in lack of knowledge of positioning, or because of the use of computers. But trend-following strategies use rules which can be written down, are based on understandable inefficiencies in markets, and computers are utilised for scalability and to remove human emotion. Surely this is a ‘transparent’ box?
A reason we frequently hear for not liking trend-following is that performance was flat for an extended period post 2008. Indeed, as Figure 1 illustrates, the BTOP50 index returned zero between 2009 and 2019 when equities returned around 200%.2 Here is that direct comparison with equities again. This may be true, but how bad is ‘flat’ in comparison to the 50% or so lost by equities twice since 2000?
Over the last four decades or so, substituting up to 50% trend-following to a traditional portfolio preserves return, but substantially reduces volatility and drawdowns.
Some Parting Comments
We are sympathetic to the argument that it is hard to hold an investment that doesn’t make any money for 10 years. We might argue that the ‘Fed put’ was detrimental to trends and beneficial to equities over the period, but that is by-the-by. Every strategy has its day in the sun.
But think about the portfolio. If you hold a trend-following strategy alongside your traditional equity portfolio, in the long term, history suggests that both should be profitable. Further, during crises, trend-following can potentially help cushion losses. Holding the two together gives higher risk-adjusted returns and lower drawdowns than traditional assets alone. As we highlight in Figure 4, over the last four decades or so, substituting up to 50% trend-following to a traditional portfolio preserves return, but substantially reduces volatility and drawdowns. While it is fresh in our memories, notice how a 50/50 blend eradicates 2022’s drawdown.
Figure 4. Allocation to Trend-Following Can Enhance Risk-Adjusted Returns (Upper Panel) and Drawdowns (Lower Panel) of Traditional Equity Portfolios
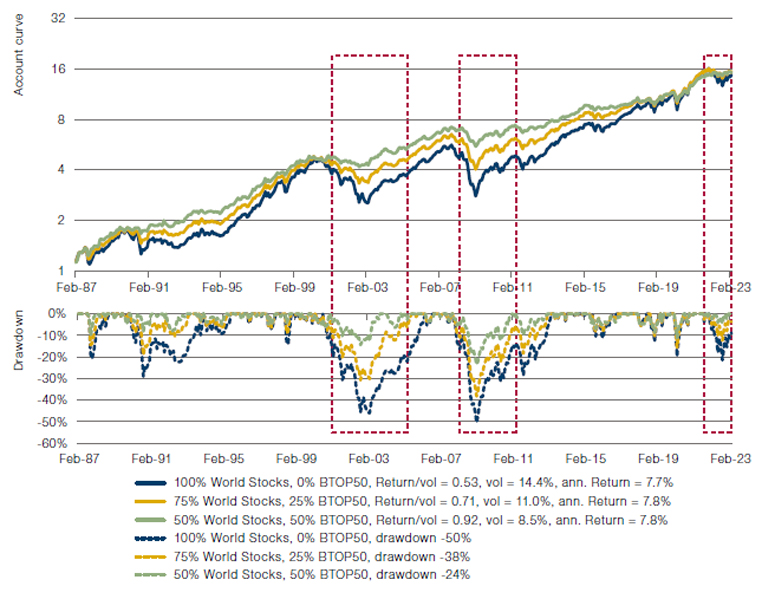
Source: Man Group, BarclayHedge, Bloomberg; Between 1 January 1987 and 31 March 2023.
Trend-following represented by Barclay BTOP50 Index; world stocks represented by MSCI World Net Total Return Index.
There is also the potential to monetise the improvements in risk properties afforded by the inclusion of trend-following by adding leverage to the whole portfolio, but we will discuss this in a future article.
Conclusion
If you want to buy a house, you might listen to your estate agent / realtor with some degree of skepticism. They are interested parties, after all. Man AHL has been running trend-following strategies for over three decades, so we are interested parties in this discussion too. But we have tried to be objective in writing this article; all performance numbers are at the index level.
It remains a surprise to us that trend-following strategies are not more popular than they are. To finish where we started, trend-following performs as well as equities in the long term, is lowly correlated, has better risk-management properties, and generally works well when equities don’t. It works particularly well in conjunction with equity portfolios. What’s not to like about that?
Bibliography
Greyserman, A., & Kaminski, K. M. (2014). “Trend Following with Managed Futures. The Search for Crisis Alpha”. Wiley
Kahneman, D., & Tversky, A. (1979). “Prospect theory: An analysis of decision under risk”. Econometrica, 47, 263-291.
Mackic, A. (2023), “The Need for Speed in Trend-Following Strategies’, Man Institute, Available at: www.man.com/maninstitute/need-for-speed-trend-following
Robertson, G. (2022), “Gaining Momentum: Where Next for Trend-Following?”, Man Institute, Available at: www.man.com/maninstitute/gaining-momentum-trend
1. CTA assets under management: www.barclayhedge.com/solutions/assets-under-management/cta-assets-under-management/cta-industry/ Bloomberg: World Exchange Market Capitlisation.
2. From 31 January 2009 to 31 May 2019, MSCI World Net Total Return Index, Hedged USD.
You are now exiting our website
Please be aware that you are now exiting the Man Institute | Man Group website. Links to our social media pages are provided only as a reference and courtesy to our users. Man Institute | Man Group has no control over such pages, does not recommend or endorse any opinions or non-Man Institute | Man Group related information or content of such sites and makes no warranties as to their content. Man Institute | Man Group assumes no liability for non Man Institute | Man Group related information contained in social media pages. Please note that the social media sites may have different terms of use, privacy and/or security policy from Man Institute | Man Group.